What is a map?

A map is a flat drawing of a place or part of the earth as if drawn from the view of someone sitting above.
A map is to illustrate specific and detailed features of a particular area, most frequently used to illustrate geography. Maps attempt to represent various things, like political boundaries, physical features, roads, topography, population, climates, natural resources and economic activities.
Maps have been around for over 5000 years or so. Cartography was significantly advanced in ancient Greece. The notion of a spherical Earth was recognized among Greek philosophers by the time of Aristotle and has been acknowledged by all geographers ever since.Ancient maps can be fouind in cave painting and rock carvings.
Cartography can be described as the art and science of map making. Apart from designing and producing maps, cartography includes studying the history of maps, printing, distributing and selling them, collecting, conserving and curating them in map libraries.
The following is a list of map used by geographers and a description of what they are and an example of each kind.
Differentiate between map, plan. sketch, and photograph
A map is a representation or drawing of an area or location or a vertical plan of a region.
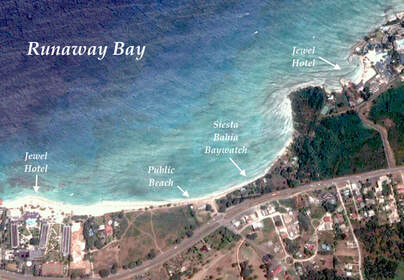
A photograph is an image of an area or location as seen from a certain vantage point.
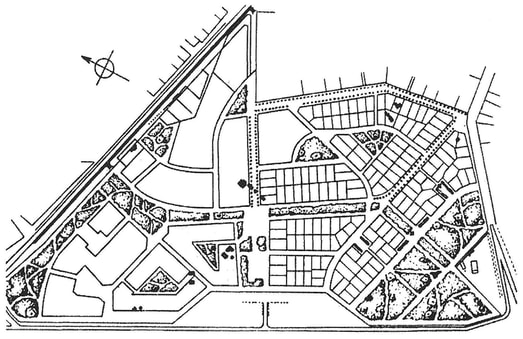
A plans are a set of two-dimensional diagrams or drawings used to describe a place or object, or to communicate building or fabrication instructions.
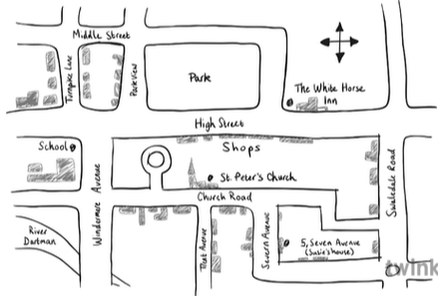
A sketch is a freehand drawing which is never treated as a finished work.
TYPES OF MAPS
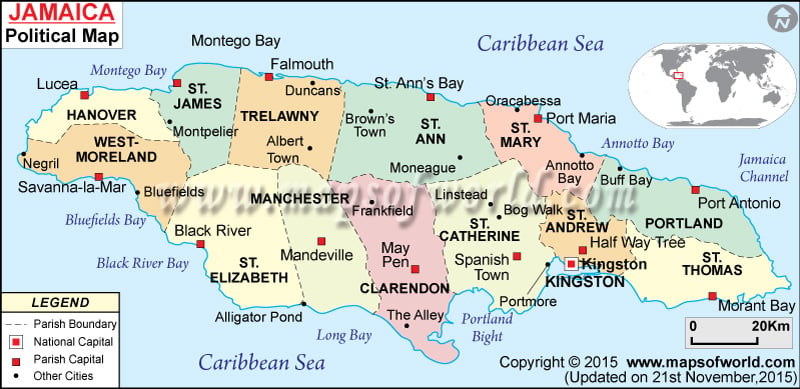
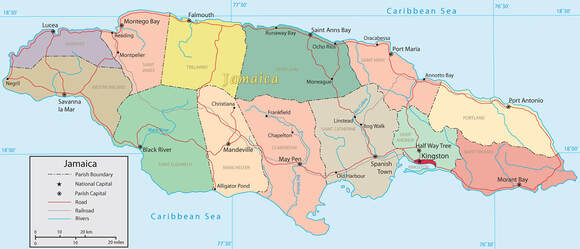
Political Map: A political map does not show any topographic features. It instead focuses solely on the state and national boundaries of a place. They also include the locations of cities - both large and small
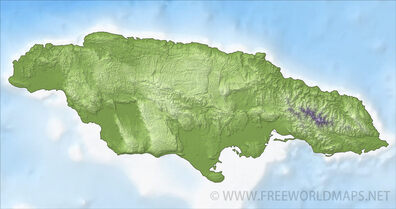
Physical map - A physical map is one that documents landscape features of a place. These maps generally show things like mountains, rivers, and lakes. Bodies of water are commonly shown in blue. Mountains and elevation changes are sometimes shown with different colors and shades to show elevation. On physical maps, greens usually indicate lower elevations while browns usually indicate higher elevations.
Topographic Maps
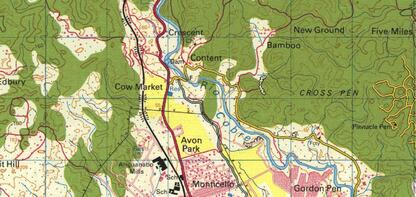
A topographic map is similar to a physical map in that it shows different physical landscape features. Unlike physical maps, though, this type of map uses contour lines instead of colors to show changes in the landscape. Contour lines on topographic maps are normally spaced at regular intervals to show elevation changes
N.B. Contour Lines - a line on a map joining points of equal height above or below sea level. Contour line are normally brown in colour.
Climate Maps
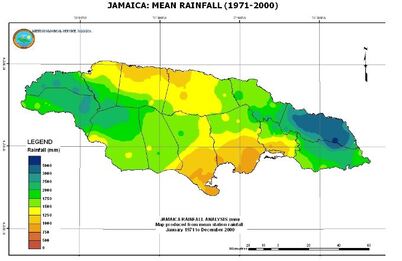
A climate map shows information about the climate of an area. These maps can show things like the specific climatic zones of an area based on the temperature, the mean annual rainfall, the amount of snow an area receives, or the average number of cloudy days. These maps normally use colors to show different climatic areas.
A climate map shows information about the climate of an area. These maps can show things like the specific climatic zones of an area based on the temperature, the mean annual rainfall, the amount of snow an area receives, or the average number of cloudy days. These maps normally use colors to show different climatic areas.
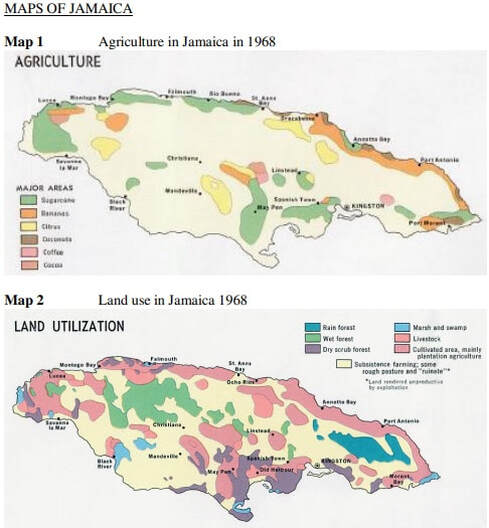
Economic or Resource Maps
An economic or resource map shows the specific types of economic activity or natural resources present in an area through the use of different symbols or colors depending on what is being depicted.
An economic or resource map shows the specific types of economic activity or natural resources present in an area through the use of different symbols or colors depending on what is being depicted.
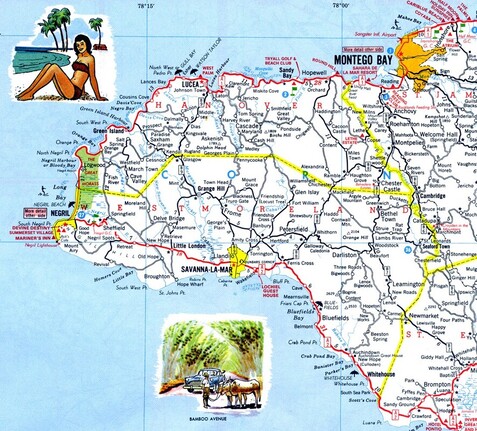
Road MapsA road map is one of the most widely used map types. These maps show major and minor highways and roads (depending on the degree of detail), as well as things like airports, cities, and points of interest such as parks, campgrounds, and monuments. Major highways on a road map are generally shown with thick, red lines, while minor roads are lighter in color and drawn with narrower lines.
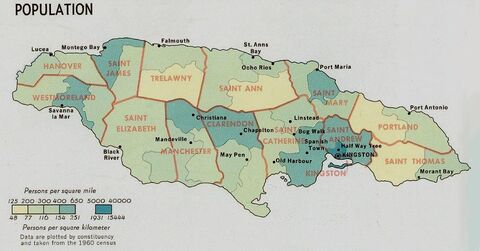
Thematic Maps
A thematic map is a map that focuses on a particular theme or special topic. These maps are different from the other maps because they do not just show features like rivers, cities, political subdivisions, elevation, and highways.
A thematic map is a map that focuses on a particular theme or special topic. These maps are different from the other maps because they do not just show features like rivers, cities, political subdivisions, elevation, and highways.
Types of maps-slide show - www.slideshare.net/esample458/types-of-maps-36597055?qid=673fa84d-f45a-46ba-9c3a-98f27817a26f&v=&b=&from_search=2
Parts of a map / Elements of a good Map
1. TITLE: the title should be in a large font, easily identifiable as the title of the map and should include descriptive text as to the location and purpose of the map. If the map is thematic, the theme should be included in the title. For example: Corn Production in Washington, 1990. The title is usually the largest font size of all lettering on the layout, however, it should not dominate the map graphic itself. The title may or may not be in a box and does not need to be at the top of the page (
though it often is). For published materials (e.g., books or articles) the title may be included in a figure caption instead.
2. SCALE INDICATOR: the scale of the map is typically indicated by a graphic bar scale, a representative fraction or a verbal scale. The reader must be able to determine the relationship between a unit of measure on the map and a unit of measure
in the real world.
3. ORIENTATION: a map should indicate which way is north (and/or south, east and west). Commonly this is done by a north arrow or compass rose. Orientation may also be shown by graticule or grid marks (e.g. lines of latitude and
longitude). By convention north is towards the top of the page (thus some maps do not have north arrows), but the
orientation must still be given for a 'proper' map. North does not have to be at the top of the page and a north arrow is
essential in maps where it is not.
4. BORDER(s) (or Neatline): a border identifies exactly where the mapped area stops. The border is often the thickest line on
the map and should be close to the edges of the mapped area. The distance between the map and the border should be the
same on all sides (balanced).
There can also be a border around the entire map layout (enclosing and grouping the title, legend, text boxes, etc.).
Both of these borders are sometimes referred to as a 'neatline.' In addition, there is sometimes a thin additional line just outside of a border (accentuating it and ideally making it more visually appealing) that may also be referred to as a
neatline.
5. LEGEND: a legend defines the symbols or colors (including shades of gray and patterns) used on the map. Maps do not need legends if the symbols is so common or simple as to be easily understood by the reader. However, it must be clear
what each marker or line type, weight and pattern represents. The legend does not need to be labeled "Legend." The more
complicated the symbols on a map the more important the legend becomes.
PARTS
OF A
GOOD
MAP
OF A
GOOD
MAP
